In The Unexpected Result of Twisting on the Magic Paving Stones, I showed that the scenario behind the Magic Paving Stones puzzle/paradox – at least when twisted – correlates with the notion of the OE curve, in a FUGE universe. The monster correlates with a photon, the magic paving stones inflate the path/universe at a rate that is proportional to the preset number, and you are an observer. While it sounds like being reached by a photon is not quite as dire as being reached by a monster, I never did actually say what the monster would do when it reached you, perhaps all it would do is trigger one of the photoreceptor cells in your eye.
When I mentioned this at reddit, I noted that expansion of
the universe is thought to be accelerating in the Standard Model. But my thinking was that since this is
equivalent to an ever-increasing number of magic paving stones being added each
round (on either side of the monster, in front and behind), it would make sense
that the monster would still get you – eventually. There would still be a possibility of paving
stones appearing behind the monster, meaning that it might take longer but the
monster would still get you.
I modified my code to incorporate expansion such that, each
round, the pathlength would increase by a truncated percentage. For example, if the initial pathlength was 25
paving stones and the percentage selected was 4%, then in the first round the
number of paving stones would be increased by 25*0.04=1, then they would
increase by one each round, for 25 rounds, until there were 50 (50*0.04=2). Then they would increase by 2 each round for
13 rounds, until there were 76 (76*0.04=3.04), then the increase would be 3 for
8 rounds, 4 four 7 rounds, 5 for 5 rounds, 6 for 4 rounds, 7 for 4 rounds, and
so on.
What I found was that, for an increase value of 4% and for
initial pathlengths of greater than 25 with the twisted scenario (so the
monster is one step closer at the start), there was small chance that the
monster would not get you.
That chance increases rapidly as you increase the initial pathlength.
The most common result with an initial pathlength of 26 was
something like this:

A far less common result, for which I had to run the
simulation 79 times the first time, 383 times the second time and 322 times the
third time before it occurred (and the fourth time I exited after 400 refreshes
without any triggering), was this:

That little kick up at the
end is more extreme (occurs earlier and is more frequent) when the initial
pathlength is greater, for example using 40 when it manifested immediately five
times in a row:

This is interesting, but we
need to be careful about these chunky initial states, by which I mean states in
which the random influences are comparatively large. I wanted to look at a less
chunky scenario, specifically where the initial pathlength is 801, the monster
starts on 800 and the percentage increase per round in 0.125% (=1/800). My intuition (which was wrong) was that this
would also be unstable. It’s not, I
could refresh numerous times and the monster gets you every time.
It only gets unstable (for a
percentage of 0.125%) at a pathlength of about 1032-ish at which point monster only
gets you roughly half the time – of course it happens earlier but at a lower frequency.

A result like the above is
not unusual with those values (although there’s usually either a kick at the
end, or the monster has got you before 10,000 rounds).
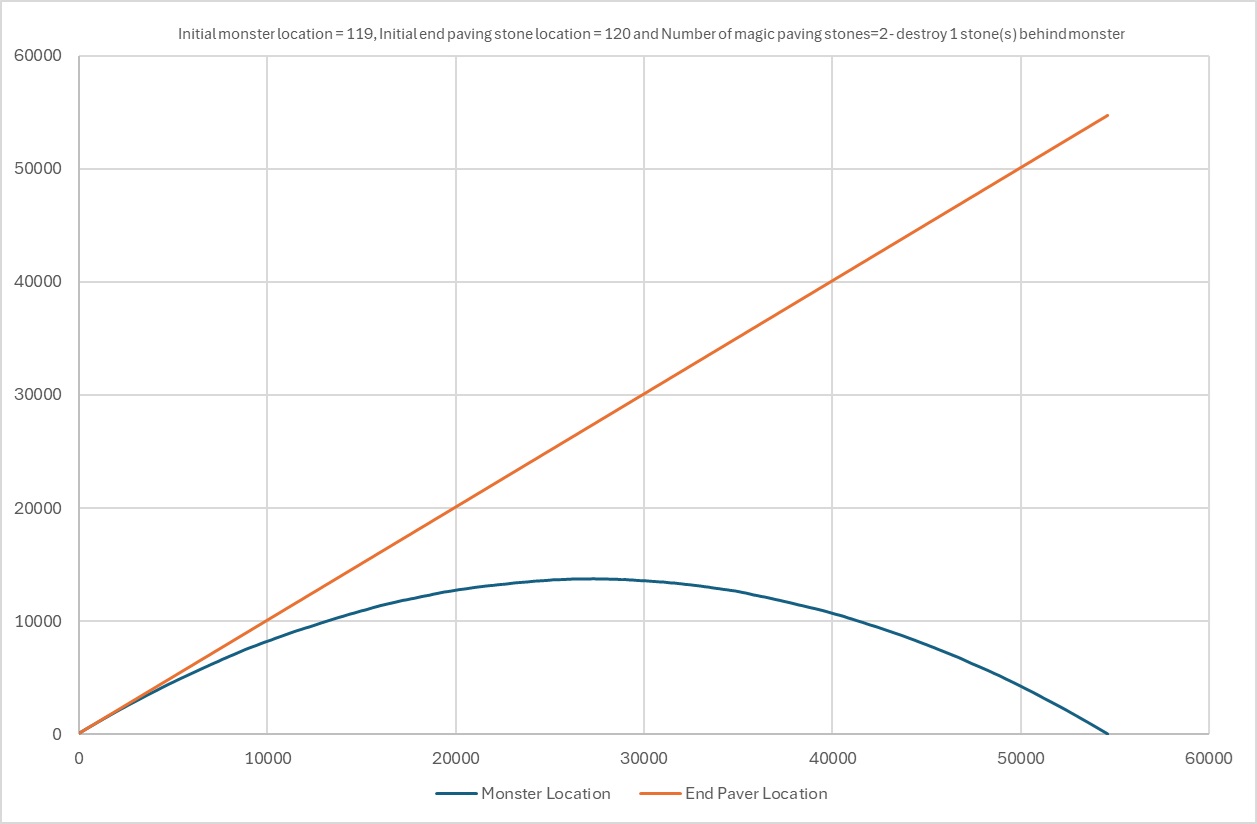
There seems to be a pattern
here, if we increase the initial pathlength and decrease the acceleration proportionately,
we get this:

In this case the monster got
you, but only after a very long time. There
are so many calculations with values of this size that my machine slows down
too much to carry out many refreshes, and increasing the pathlength by another
order of magnitude would be an overnight (or weekend) task.
Keen-eyed readers will note
that I increased the initial pathlength by very slightly more than a factor of 10. This is because I was intending to test the
notion that the instability kicks in when the pathlength equals the inverse of
the percentage increase per round times the square root of one and two thirds. While it does seem to really manifest at about
pathlength=1.29*1/percentage, 1.29 is not the actual value (and neither is
1.29099444) – the monster seems to get you every time with the values above (usually
within about 40,000-60,000 rounds).
The precisely nature of this
effect, and the mechanism behind it remains unclear. What is clear though is that the closer the
monster is at the beginning, the more likely it is to get you:

Removal of a single paving stone is actually
enough to massively increase the likelihood that the monster will get you, or
in this case about 0.1% closer.
---
The question that I have, of course, is whether this in any way
correlates with the accelerated expansion of the Standard Model universe during
the Dark-Energy-Dominated era. We’d have
to think about the time at which that era commenced, about 4 billion years ago,
at which time the Hubble parameter value was about 66.5 km/s/Mpc (because in
the Standard Model, in that era, H(t)=2/(3t) where t is the time
elapsed since the Big Bang). Assuming
that the Hubble parameter has increased uniformly since then, to reach the current
value (H(t)≈1/t≈70), and using a year as our unit
of time, this would equate to an increase (Δ) given by:
Δ=4000000000√(70/66.5)-1=1.28×10-9%
This is using a 4 billionth root, but of course the granularity of the universe isn’t at the scale of years, it’s about 6×1050 times finer, meaning that the increase per Planck time is in the order of 2×10-60%. (This is because x=y1/z-1, where y-1→0, then y1/(z*w)-1→x/w. I asked whether there is proof for this at Reddit and was given one. I don't doubt that proof, but it's one of those back of the napkin things that will work for a mathematician but have shades of appeal to authority for anyone else. But that is better than the brute method that I had which was to just keep inserting values in and find that it works every time, which you can try yourself if you prefer.)
By implication from the above, it would seem that a photon would reach us reliably (albeit after a long time) if it were emitted a little bit less than about 6×1059 Planck lengths away, which is 3.5×10¹⁶ light years, or about 35 million billion light years.
If the logic above is correct, then the claim that a photon that is only 15 billion light years away would never reach us would be incorrect. Perhaps the nature of the acceleration of expansion in the Standard Model is not as I have described.